


Main menu:
- Annual Maintenance Agreement
- Constructed Waterway Designer
- Cross-section grades
- Download & Install (Members)
- Download & Install (Single-users)
- Help file
- Installation and Registration
- Installation - write access
- Printing (PC-Convey)
- Rating Table
- Screen resolution
- Shear stress
- Security - Member's Area
- System requirements
- Top of Bank Markers
- Version 12.0 Beta
Printing (PC-Convey)
Knowledge Base > FAQs
Can I get a print out of the discharge rating table (level versus flow only)?
When I print, the bottom part of the page doesn't print.
The word "Freeboard" doesn't print in the correct place.
You can use the "Output to File" option from the Control Panel to save output to 3 files that can then be read into Excel (for example) and formatted / graphed etc. This output has several decimal places, and can be rounded (in Excel for example) to however many you need. See the "Output to File" section in the Help within PC-Convey for more details.
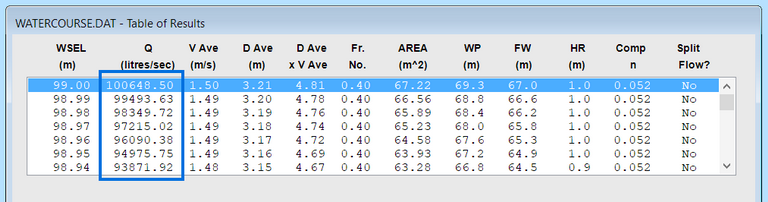
Alternatively, with the Discharge Units set to litres/sec you could obtain a screen shot of the Table of Results print-out. For example, this cross-section shows the maximum discharge as 100648.50 litres/sec = 100.64850 cumecs:
Printing a Rating Table
1. Pipe Flow
From Version 7.20 you can view or print a rating table for flow in the pipe selected on the Discharge Information screen by selecting "View/Print Rating Table". From Version 9.00 you can also output this to a text file.
2. Channel Flow
After loading in (or creating) a cross-section data file, you can select “Output to file” from the “Output” option on the Main Menu. This creates 3 text files in the same folder as the data file. (A check is done to see whether the files already exist in that folder, and a warning is given if they do.) These text files contain:
(i) the Water Surface Elevation, Discharge, Velocity and Area for the whole cross-section,
(ii) the Table of Results output values, and
(iii) the Overbank Output values.
The output filename contains the name of the input file, some text to identify what output the file contains, and the current calculation increment. For example, if the input filename is “yarra_xs_001.dat” and the calculation increment is 0.01, you will get the following output files:
(i) “yarra_xs_001_Overbank_01.txt”
(ii) “yarra_xs_001_TableOfResults_01.txt”
(iii) “yarra_xs_001_WSELQVA_01.txt”
By changing the calculation increment to 0.1 you can cut the output down to 10% of the size (roughly) but still end up with the same rating table graph. The calculation increment value you adopt will depend on the amount of detail you need in your results tables etc. For the above example, if the calculation increment was changed to 0.1 you would get these three files:
(i) “yarra_xs_001_Overbank_10.txt”
(ii) “yarra_xs_001_TableOfResults_10.txt”
(iii) “yarra_xs_001_WSELQVA_10.txt”
The files can be read into Excel by selecting “Open”, and then changing the file type to All Files or Text Files. After selecting the required output file, the Text Import Wizard comes up and you select Next (Delimited data), then “Comma delimited” and Finish from the next page. The data will be loaded into Excel with column headings, and you can then quickly create graphs or manipulate the data as you need to.
You can adjust the footer position and the number of printable lines per page from within the program. This is found under Setup \ Printout Options on the top Menu bar. Try adjusting the settings until all the details you would like printed are visible.
This has been fixed from Version 12.10B.
For those with earlier versions, a workaround is shown here:
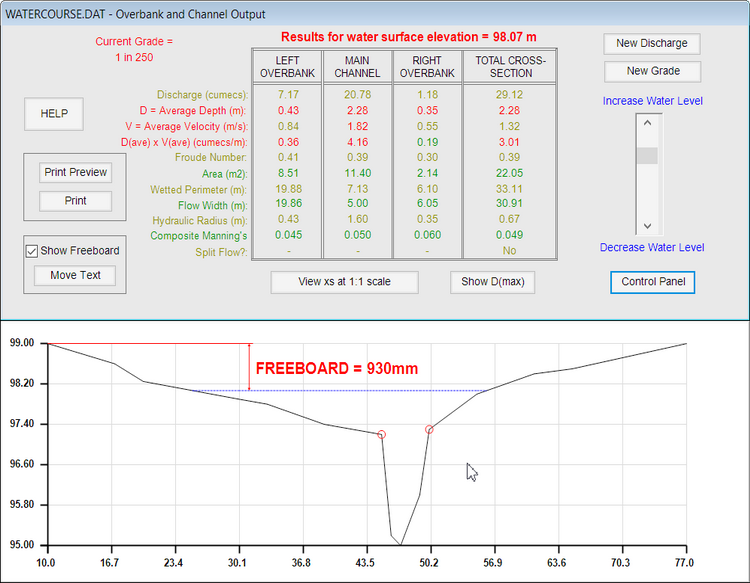
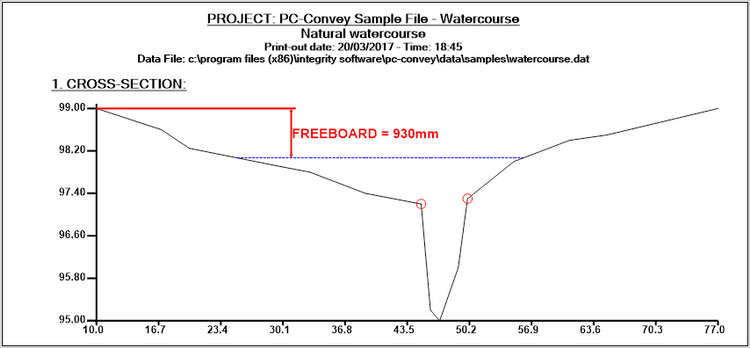
On some PCs the location of the Freeboard text shows incorrectly when printed or previewed. Even though the text appears correctly on the screen ...
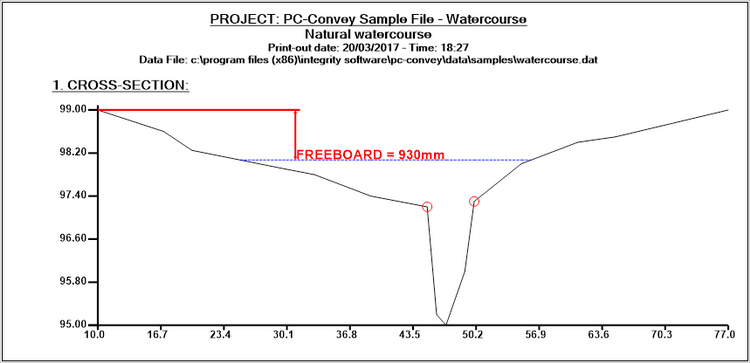
... it is wrong when printed or previewed:
You can use the Move Text control to raise the position of the Freeboard text on the screen.
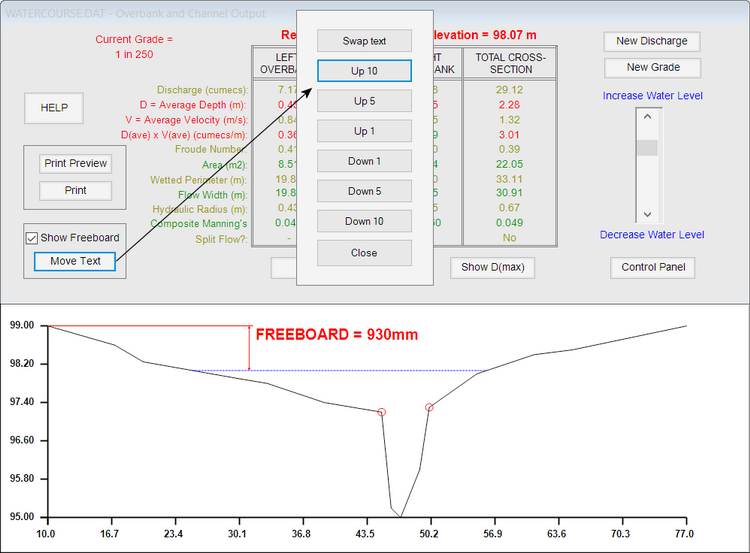
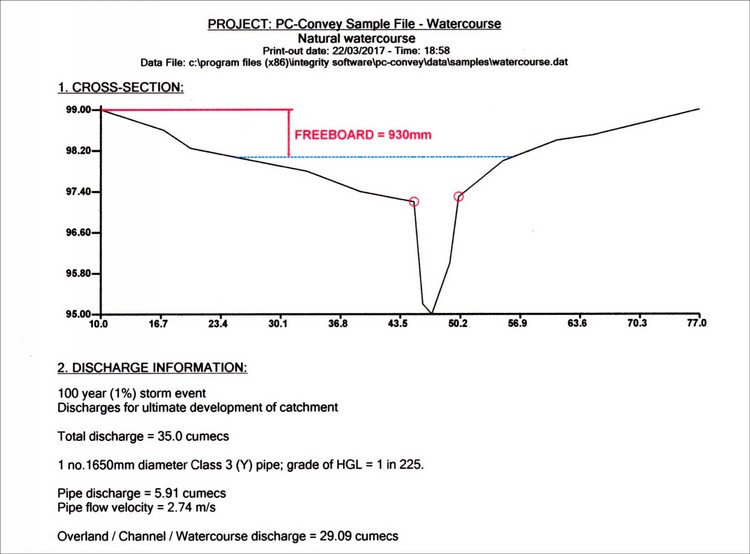
While this is now incorrect on the screen, the Preview should be better ...
... and the print-out should be correct:
Home | Products | Downloads | Purchase | Knowledge Base | Latest News | Contact Us | Members' Area | General Site Map