


Create a cross-section
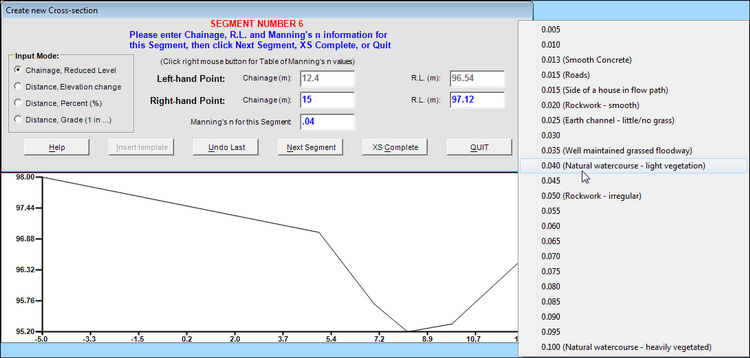
The Input Screen is shown below. You enter the Chainage and Reduced Level (elevation) of the Points of your cross-section, and by clicking the right-hand mouse button you can access a table of Manning's n (roughness) values which, when selected, will be placed in the Manning's n input box (see right-hand side of screen shot below).
The cross-section is drawn on-screen as you enter the data.
There are four Input Modes for entering the data via the Input Screen, or if you have a cross-section that you use regularly (e.g. a road) you can input that part of the cross-section by using a template (see next page). You can also import data from the clipboard or a .csv file (see later in the Guided Tour). Which Input Mode you use will depend on the type of cross-section you are entering, and you can switch between methods while creating a single cross-section.
If you have a list of Chainage and Reduced Level (Elevation) pairs you can enter the data that way.
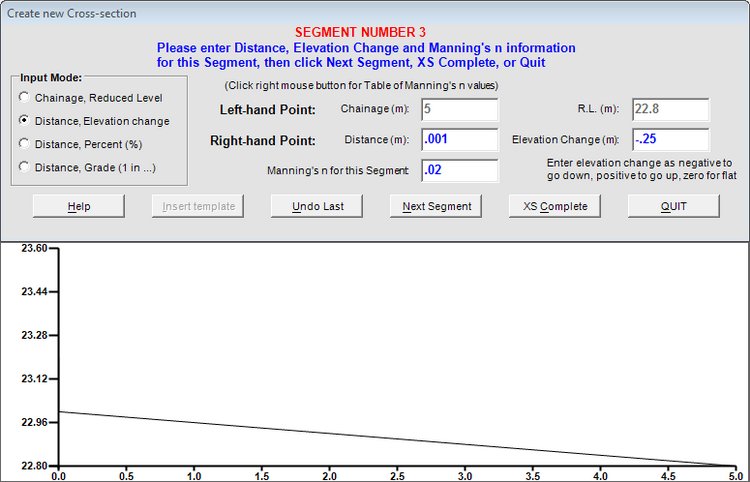
Alternatively, if you were creating a road cross-section you could use the Distance, Elevation change Mode. The next screen shot shows the data being entered for the kerb of a road. The chainage of Points must always increase so a Distance of 1mm (.001m) has been used to simulate the vertical kerb. The kerb is 250mm high and we want the kerb level to be lower than the previous level so a negative Elevation Change is used (-.25):
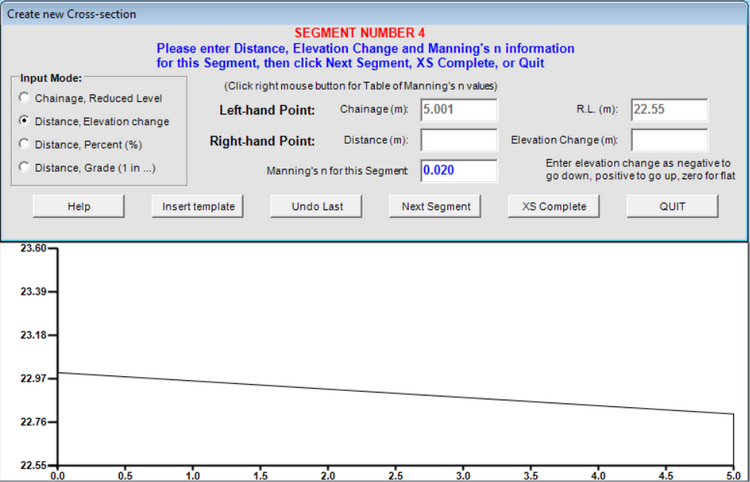
On selecting Next Segment the cross-section looks like this, with the kerb now visible:
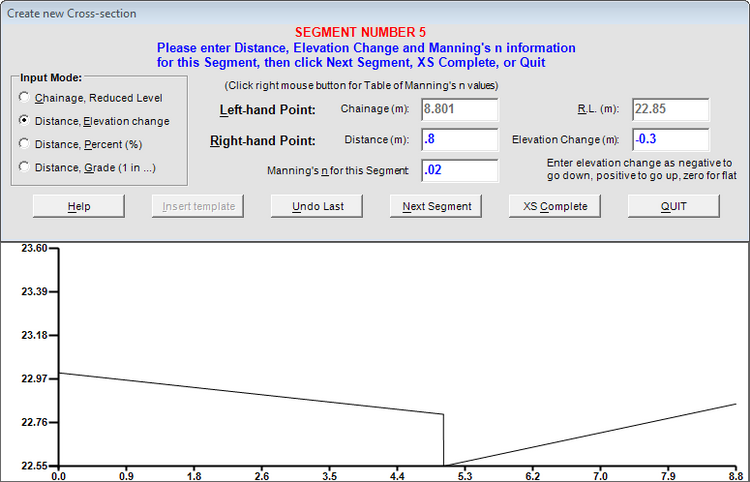
The next Segment is the first half of the road, which rises by 300mm (hence a positive Elevation Change of 0.3m in the screen-shot above). After entering the data above and selecting Next Segment, the cross-section looks like this:
You can also choose to enter data using Distance and Percent (%) or Distance and Grade (1 in ...). The Help within PC-Convey contains more detailed information and examples.